> ## Documentation Index
> Fetch the complete documentation index at: https://docs.5x.co/llms.txt
> Use this file to discover all available pages before exploring further.
# Dashboard creation
> Learn how to create compelling interactive dashboards with charts, filters, and collaborative features
**Focus:** Master the art of creating interactive dashboards that tell compelling data stories and enable self-service analytics for your organization.
## Dashboard creation overview
Dashboards in 5X Business Intelligence are powerful tools for presenting data insights in an organized, interactive format. They combine multiple charts, filters, and text elements to create comprehensive views of your business metrics and KPIs.
### **What makes a great dashboard?**
**Focused objectives**
Each dashboard should have a clear purpose and target audience. Avoid trying to show everything in one view.
**Organized structure**
Arrange charts in a logical flow that guides users through your data story from high-level metrics to detailed insights.
**User engagement**
Use filters, drill-downs, and cross-filtering to let users explore data and find their own insights.
**Professional appearance**
Maintain consistent colors, fonts, and styling to create a professional, branded experience.
## Creating your first dashboard
### **Step 1: Access the dashboard builder**
1. **Navigate to Business Intelligence**
* From your workspace, click **"BI"** in the left sidebar
* Click **"+ Dashboard"** in the top right corner
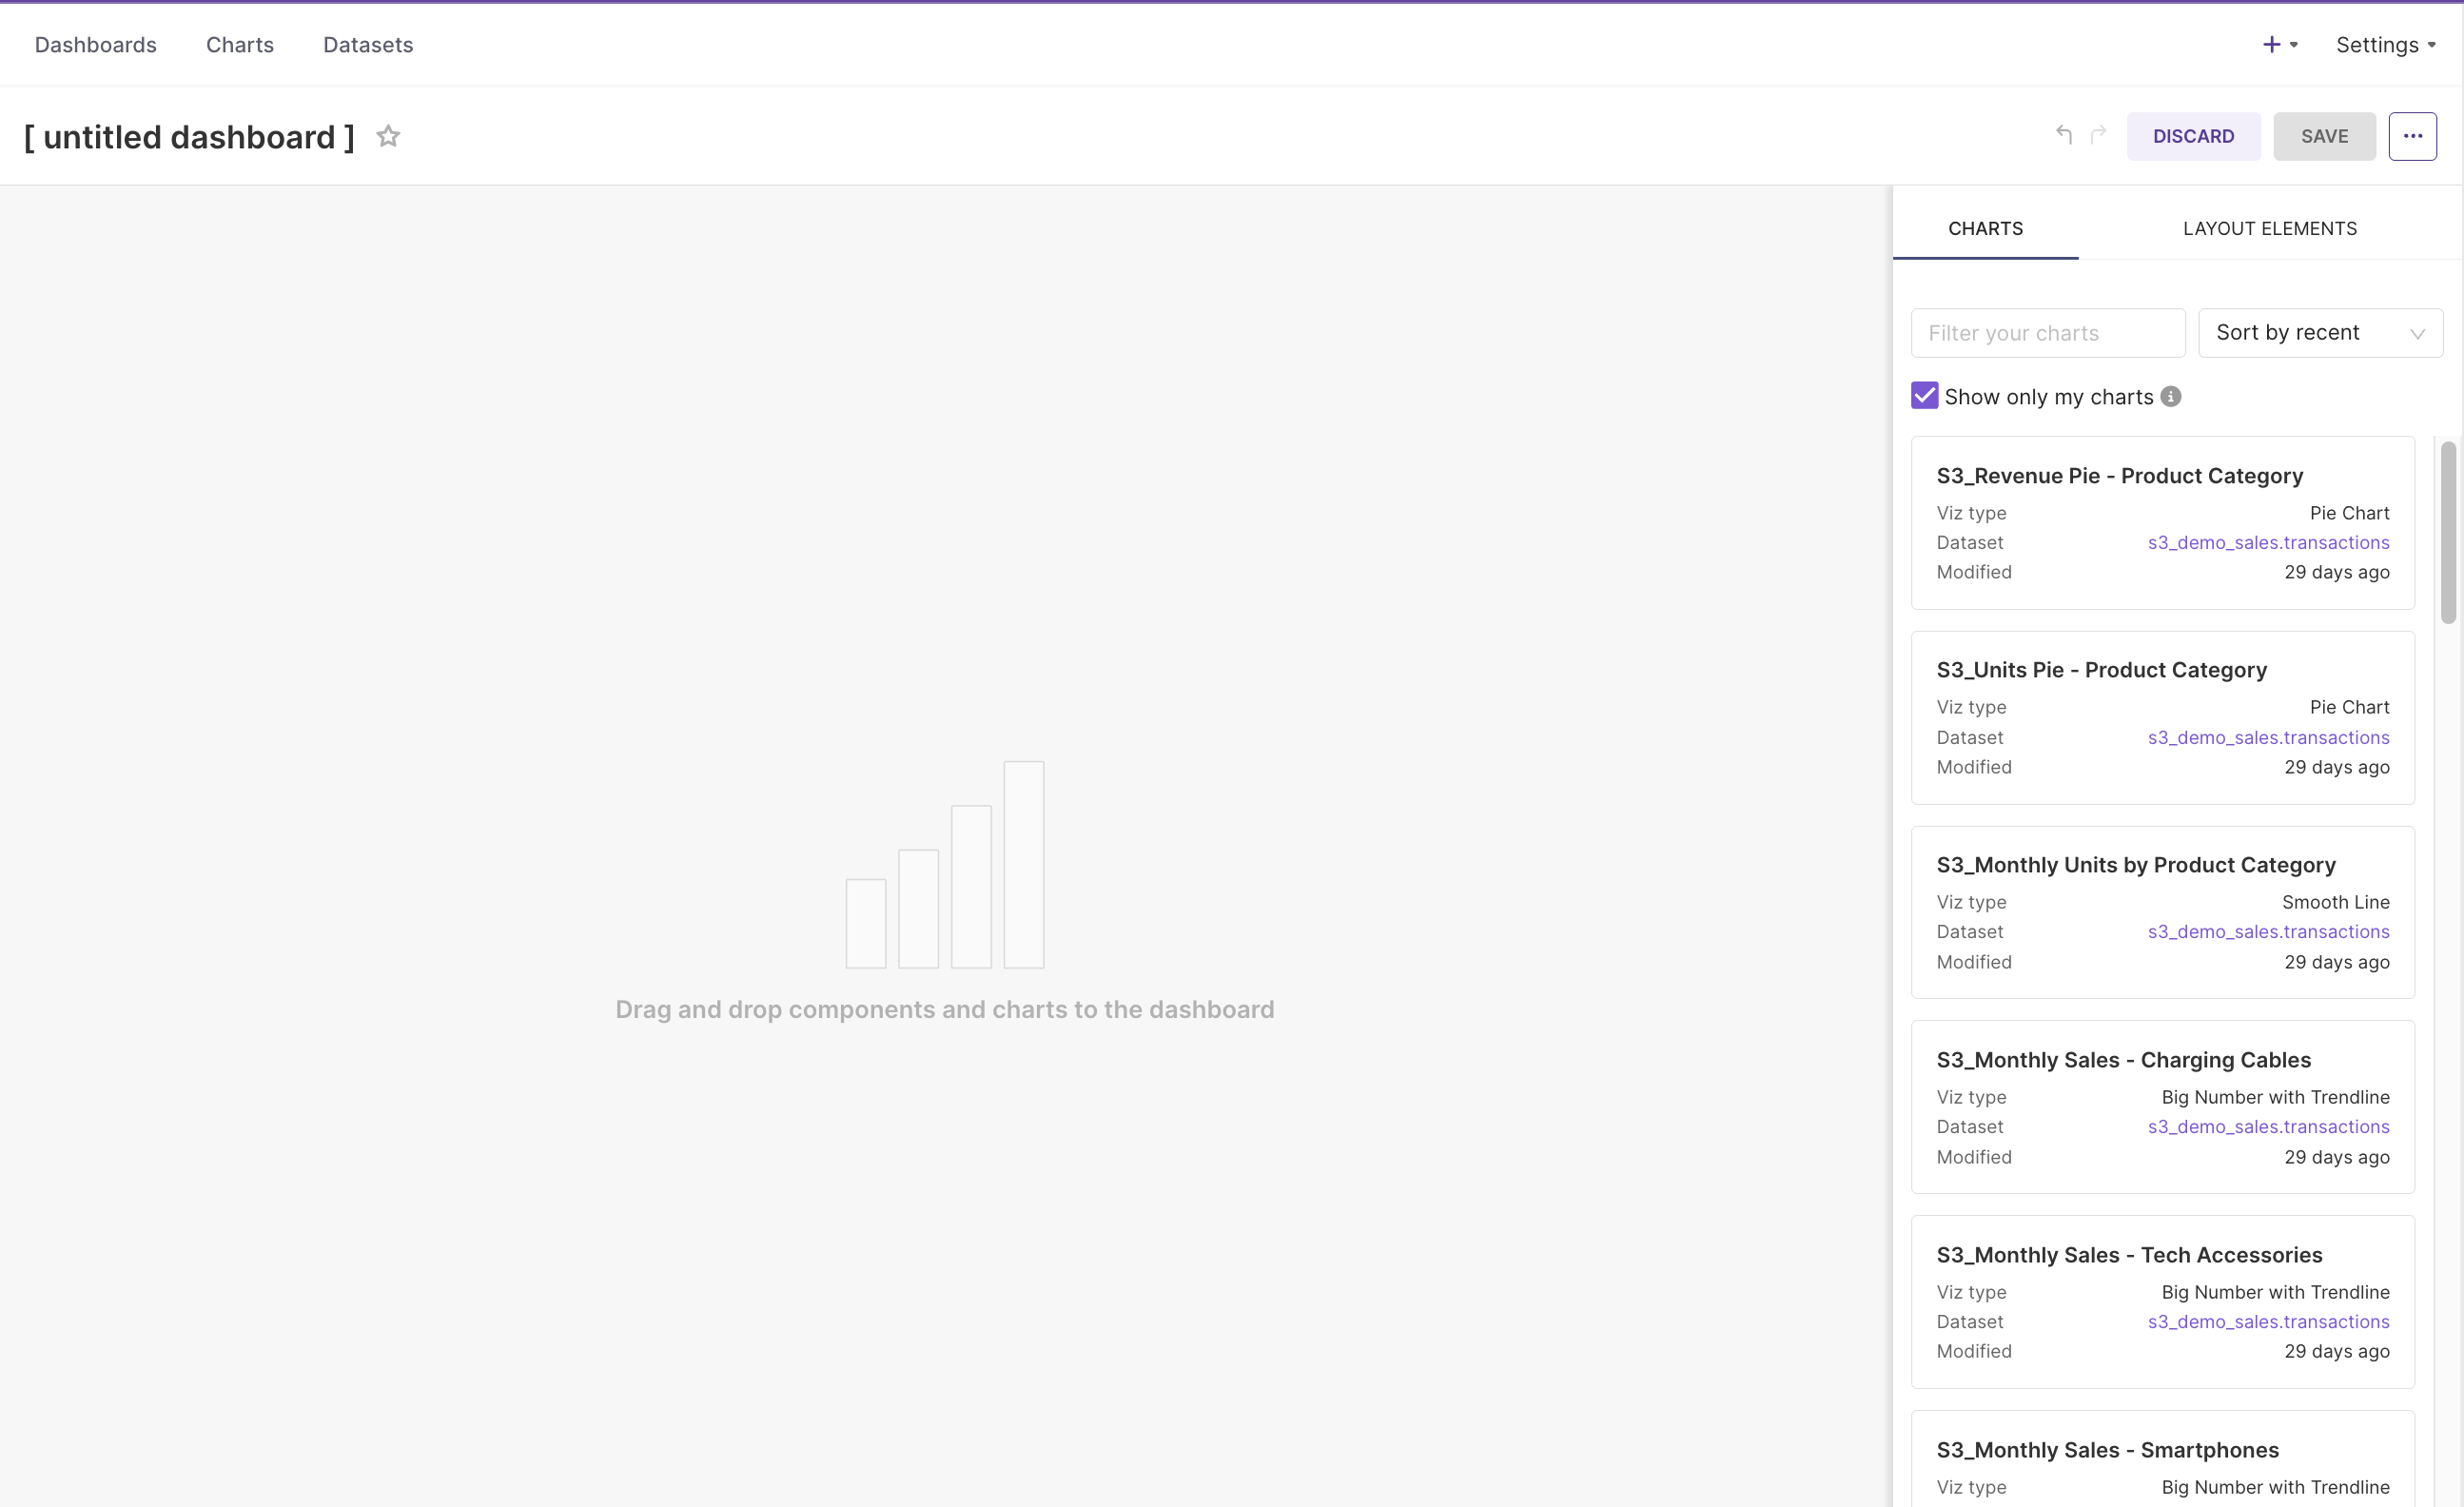
2. **Start building**
* Begin with a blank canvas to build your custom dashboard layout
 ### **Step 2: Configure dashboard settings**
Set your dashboard name, description, and tags for easy organization and discovery.
Set up automatic data refresh intervals to keep your dashboard current with the latest data.
Save your dashboard configuration and proceed to the layout builder.
### **Step 3: Build your dashboard layout**
The dashboard builder uses a flexible grid system for arranging charts and components:
**Adding components:**
* **Charts** - Drag existing charts or create new ones
* **Text boxes** - Add titles, descriptions, and context
* **Filters** - Create global filters for dashboard-wide filtering
* **Images** - Include logos, diagrams, or visual elements
**Layout principles:**
* **Top-down flow** - Place most important metrics at the top
* **Group related content** - Use rows and columns to organize related charts
* **White space** - Allow breathing room between elements
* **Responsive design** - Ensure dashboards work on different screen sizes
## Dashboard components
### **Charts and visualizations**
Charts are the core building blocks of your dashboard:
**Chart types available:**
* **Time series** - Line charts, area charts for trend analysis
* **Categorical** - Bar charts, pie charts for comparisons
* **Geographic** - Maps for location-based data
* **Tables** - Detailed data views with sorting and filtering
* **Custom** - Advanced visualizations for specific use cases
**Adding charts to dashboards:**
1. Access the dashboard builder interface
2. Select charts from your existing chart library
3. Position and resize the chart in your layout
4. Configure chart-specific settings and interactions
### **Dashboard filters**
Filters enable users to interact with your dashboard data:
**Filter types:**
* **Date range** - Filter data by time periods
* **Categorical** - Filter by specific values or categories
* **Numeric** - Filter by value ranges or thresholds
* **Custom SQL** - Advanced filtering with custom logic
**Filter configuration:**
* **Scope** - Apply to specific charts or entire dashboard
* **Default values** - Set sensible defaults for new users
* **Required filters** - Force users to select certain filters
* **Cascading filters** - Create dependent filter relationships
### **Text and annotations**
Enhance your dashboard with contextual information:
**Text elements:**
* **Titles and headers** - Clear section identification
* **Descriptions** - Explain metrics and provide context
* **Instructions** - Guide users on how to interact with the dashboard
* **Annotations** - Highlight important insights or changes
**Best practices:**
* Keep text concise and actionable
* Use consistent formatting and styling
* Provide context for complex metrics
* Include data refresh timestamps
## Best practices
### **Design principles**
**Know your audience**
Design dashboards for specific user personas and their information needs.
**Layer information**
Start with high-level metrics and allow users to drill down for details.
**Standardized KPIs**
Use consistent metric definitions across all dashboards for reliable insights.
**Keep data fresh**
Ensure dashboards reflect current data with appropriate refresh schedules.
### **Common pitfalls to avoid**
**Overwhelming users:**
* Too many charts on one dashboard
* Complex layouts without clear hierarchy
* Missing context or explanations
* Inconsistent styling and formatting
**Performance issues:**
* Loading too much data at once
* Inefficient queries and calculations
* Missing data refresh strategies
* Ignoring mobile user experience
**Poor user experience:**
* Unclear navigation and interactions
* Missing or confusing filters
* Inconsistent metric definitions
* Lack of responsive design
## Troubleshooting
### **Common dashboard issues**
**Possible causes:**
* Data source connection issues
* Insufficient permissions for data access
* Query errors or timeouts
* Missing or invalid chart configurations
**Solutions:**
* Verify data source connections
* Check user permissions and roles
* Review query performance and optimization
* Validate chart configuration settings
**Possible causes:**
* Incorrect filter configuration
* Data type mismatches
* Missing filter dependencies
* Cache or refresh issues
**Solutions:**
* Review filter settings and scope
* Verify data types and formats
* Check filter dependencies and cascading
* Clear cache and refresh data
**Possible causes:**
* Large data volumes
* Inefficient queries
* Complex calculations
* Network or infrastructure issues
**Solutions:**
* Optimize data queries and filters
* Implement data aggregation strategies
* Use caching for frequently accessed data
* Monitor and optimize infrastructure
***
**Next: Create charts**
Learn how to build compelling charts and visualizations for your dashboards.
**Connect to data**
Set up your data connections to power your dashboards.
### **Step 2: Configure dashboard settings**
Set your dashboard name, description, and tags for easy organization and discovery.
Set up automatic data refresh intervals to keep your dashboard current with the latest data.
Save your dashboard configuration and proceed to the layout builder.
### **Step 3: Build your dashboard layout**
The dashboard builder uses a flexible grid system for arranging charts and components:
**Adding components:**
* **Charts** - Drag existing charts or create new ones
* **Text boxes** - Add titles, descriptions, and context
* **Filters** - Create global filters for dashboard-wide filtering
* **Images** - Include logos, diagrams, or visual elements
**Layout principles:**
* **Top-down flow** - Place most important metrics at the top
* **Group related content** - Use rows and columns to organize related charts
* **White space** - Allow breathing room between elements
* **Responsive design** - Ensure dashboards work on different screen sizes
## Dashboard components
### **Charts and visualizations**
Charts are the core building blocks of your dashboard:
**Chart types available:**
* **Time series** - Line charts, area charts for trend analysis
* **Categorical** - Bar charts, pie charts for comparisons
* **Geographic** - Maps for location-based data
* **Tables** - Detailed data views with sorting and filtering
* **Custom** - Advanced visualizations for specific use cases
**Adding charts to dashboards:**
1. Access the dashboard builder interface
2. Select charts from your existing chart library
3. Position and resize the chart in your layout
4. Configure chart-specific settings and interactions
### **Dashboard filters**
Filters enable users to interact with your dashboard data:
**Filter types:**
* **Date range** - Filter data by time periods
* **Categorical** - Filter by specific values or categories
* **Numeric** - Filter by value ranges or thresholds
* **Custom SQL** - Advanced filtering with custom logic
**Filter configuration:**
* **Scope** - Apply to specific charts or entire dashboard
* **Default values** - Set sensible defaults for new users
* **Required filters** - Force users to select certain filters
* **Cascading filters** - Create dependent filter relationships
### **Text and annotations**
Enhance your dashboard with contextual information:
**Text elements:**
* **Titles and headers** - Clear section identification
* **Descriptions** - Explain metrics and provide context
* **Instructions** - Guide users on how to interact with the dashboard
* **Annotations** - Highlight important insights or changes
**Best practices:**
* Keep text concise and actionable
* Use consistent formatting and styling
* Provide context for complex metrics
* Include data refresh timestamps
## Best practices
### **Design principles**
**Know your audience**
Design dashboards for specific user personas and their information needs.
**Layer information**
Start with high-level metrics and allow users to drill down for details.
**Standardized KPIs**
Use consistent metric definitions across all dashboards for reliable insights.
**Keep data fresh**
Ensure dashboards reflect current data with appropriate refresh schedules.
### **Common pitfalls to avoid**
**Overwhelming users:**
* Too many charts on one dashboard
* Complex layouts without clear hierarchy
* Missing context or explanations
* Inconsistent styling and formatting
**Performance issues:**
* Loading too much data at once
* Inefficient queries and calculations
* Missing data refresh strategies
* Ignoring mobile user experience
**Poor user experience:**
* Unclear navigation and interactions
* Missing or confusing filters
* Inconsistent metric definitions
* Lack of responsive design
## Troubleshooting
### **Common dashboard issues**
**Possible causes:**
* Data source connection issues
* Insufficient permissions for data access
* Query errors or timeouts
* Missing or invalid chart configurations
**Solutions:**
* Verify data source connections
* Check user permissions and roles
* Review query performance and optimization
* Validate chart configuration settings
**Possible causes:**
* Incorrect filter configuration
* Data type mismatches
* Missing filter dependencies
* Cache or refresh issues
**Solutions:**
* Review filter settings and scope
* Verify data types and formats
* Check filter dependencies and cascading
* Clear cache and refresh data
**Possible causes:**
* Large data volumes
* Inefficient queries
* Complex calculations
* Network or infrastructure issues
**Solutions:**
* Optimize data queries and filters
* Implement data aggregation strategies
* Use caching for frequently accessed data
* Monitor and optimize infrastructure
***
**Next: Create charts**
Learn how to build compelling charts and visualizations for your dashboards.
**Connect to data**
Set up your data connections to power your dashboards.