> ## Documentation Index
> Fetch the complete documentation index at: https://docs.5x.co/llms.txt
> Use this file to discover all available pages before exploring further.
# Connector Management
> Manage your data connectors with monitoring, scheduling, and control tools for reliable data ingestion
**Focus:** Learn how to monitor, control, and optimize your active data connectors through the 5X management interface.
Once your connectors are set up and running, the connector management dashboard provides comprehensive tools to monitor performance, adjust scheduling, and troubleshoot issues. This guide covers all the management capabilities available in the 5X platform.
## Connector dashboard
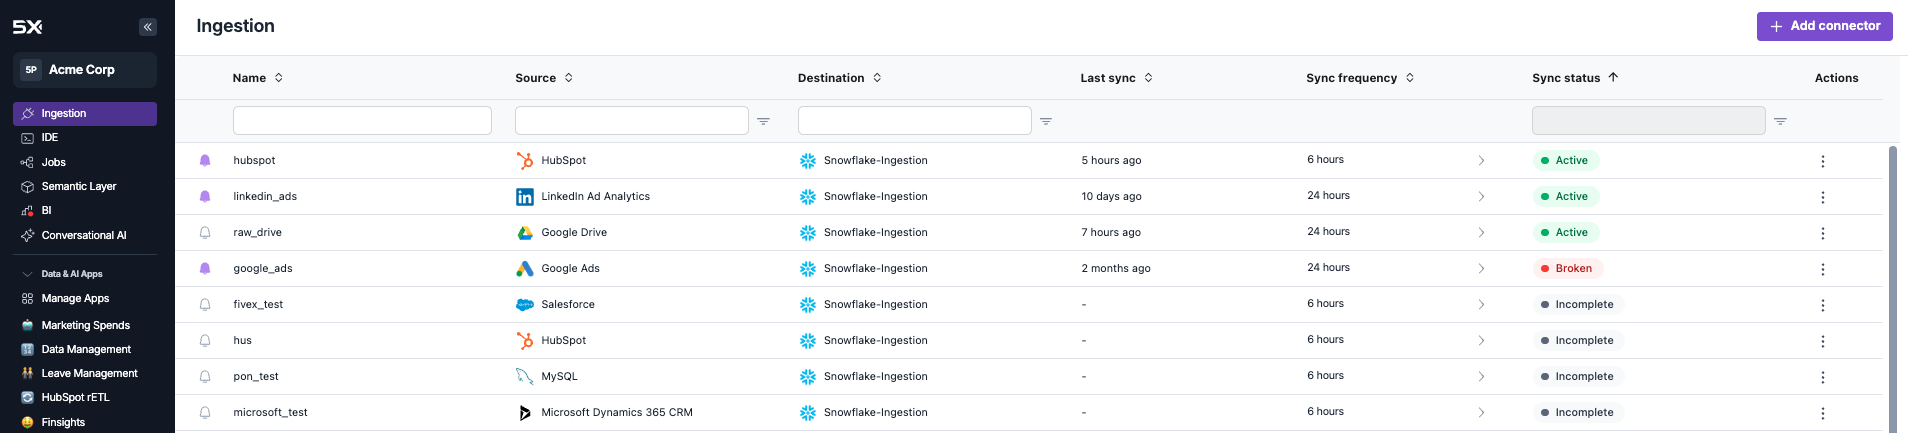
The main connector dashboard displays all your active data connections in a centralized table view:
 ### Status indicators
Each connector displays one of four possible statuses:
**Active** - Connector is running normally
* Syncing data according to schedule
* No issues detected
**Broken** - Connector has encountered errors
* Failed authentication or connection issues
* Data source unavailable or changed
* Requires immediate attention
**Incomplete** - Connector setup is not finished
* Missing required configuration
* Partial setup that needs completion
**Paused** - Connector is temporarily disabled
* Manually paused by user
* Not syncing data until resumed
Filter by status to quickly identify connectors that need attention or are in specific states.
## Connector actions
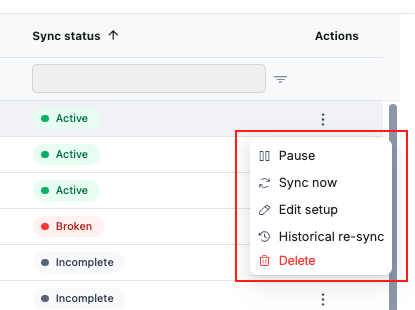
Access all connector management functions through the actions menu:
### Status indicators
Each connector displays one of four possible statuses:
**Active** - Connector is running normally
* Syncing data according to schedule
* No issues detected
**Broken** - Connector has encountered errors
* Failed authentication or connection issues
* Data source unavailable or changed
* Requires immediate attention
**Incomplete** - Connector setup is not finished
* Missing required configuration
* Partial setup that needs completion
**Paused** - Connector is temporarily disabled
* Manually paused by user
* Not syncing data until resumed
Filter by status to quickly identify connectors that need attention or are in specific states.
## Connector actions
Access all connector management functions through the actions menu:
 ### Available actions
**Control sync execution**
Temporarily stop or restart connector syncing without losing configuration
**Trigger immediate sync**
Force a sync to run immediately, outside of the regular schedule
**Modify configuration**
Change connector settings, authentication, or data selection
**Backfill historical data**
Re-sync all historical data (free operation)
**Remove connector**
Permanently delete the connector and stop all syncing
## Sync scheduling
### Frequency options
Configure how often your connectors sync data by adjusting the sync frequency:
### Available actions
**Control sync execution**
Temporarily stop or restart connector syncing without losing configuration
**Trigger immediate sync**
Force a sync to run immediately, outside of the regular schedule
**Modify configuration**
Change connector settings, authentication, or data selection
**Backfill historical data**
Re-sync all historical data (free operation)
**Remove connector**
Permanently delete the connector and stop all syncing
## Sync scheduling
### Frequency options
Configure how often your connectors sync data by adjusting the sync frequency:
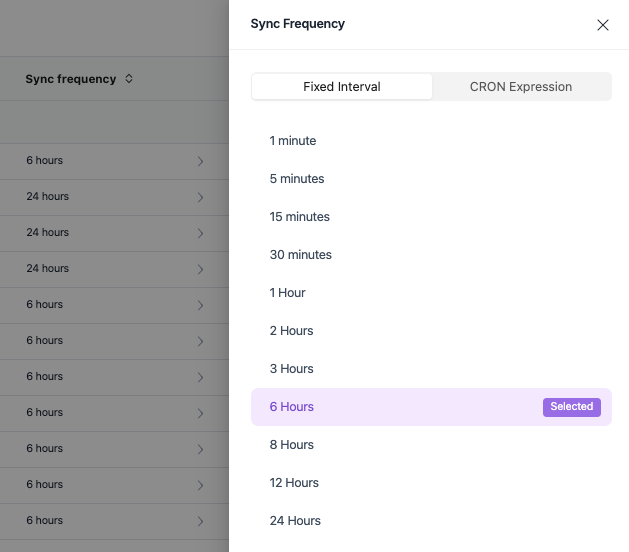 **Choose from predefined sync intervals:**
* **1 minute** - For critical, rapidly changing data
* **5 minutes** - High-frequency updates
* **15 minutes** - Frequent refresh requirements
* **1 hour** - Hourly updates
* **6 hours** - Four times daily (common default)
* **24 hours** - Once daily
*Best for:* Most standard business use cases and regular reporting needs
**Advanced scheduling with CRON expressions:**
```cron theme={null}
# Every weekday at 9 AM
0 9 * * 1-5
# Every hour during business hours (9 AM - 5 PM)
0 9-17 * * *
# Every 15 minutes during peak hours
*/15 8-18 * * *
```
*Best for:* Complex scheduling patterns and specific business requirements
## Connector details
### Individual connector view
Click on any connector to access detailed management options:
**Choose from predefined sync intervals:**
* **1 minute** - For critical, rapidly changing data
* **5 minutes** - High-frequency updates
* **15 minutes** - Frequent refresh requirements
* **1 hour** - Hourly updates
* **6 hours** - Four times daily (common default)
* **24 hours** - Once daily
*Best for:* Most standard business use cases and regular reporting needs
**Advanced scheduling with CRON expressions:**
```cron theme={null}
# Every weekday at 9 AM
0 9 * * 1-5
# Every hour during business hours (9 AM - 5 PM)
0 9-17 * * *
# Every 15 minutes during peak hours
*/15 8-18 * * *
```
*Best for:* Complex scheduling patterns and specific business requirements
## Connector details
### Individual connector view
Click on any connector to access detailed management options:
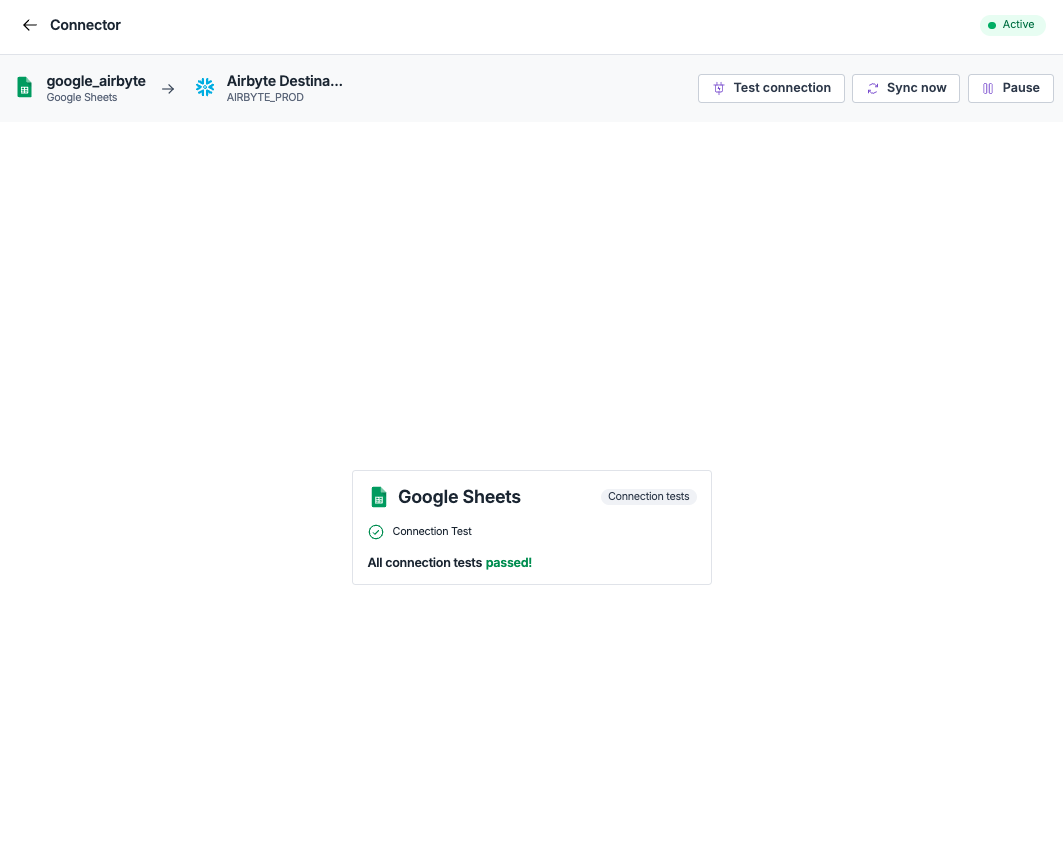
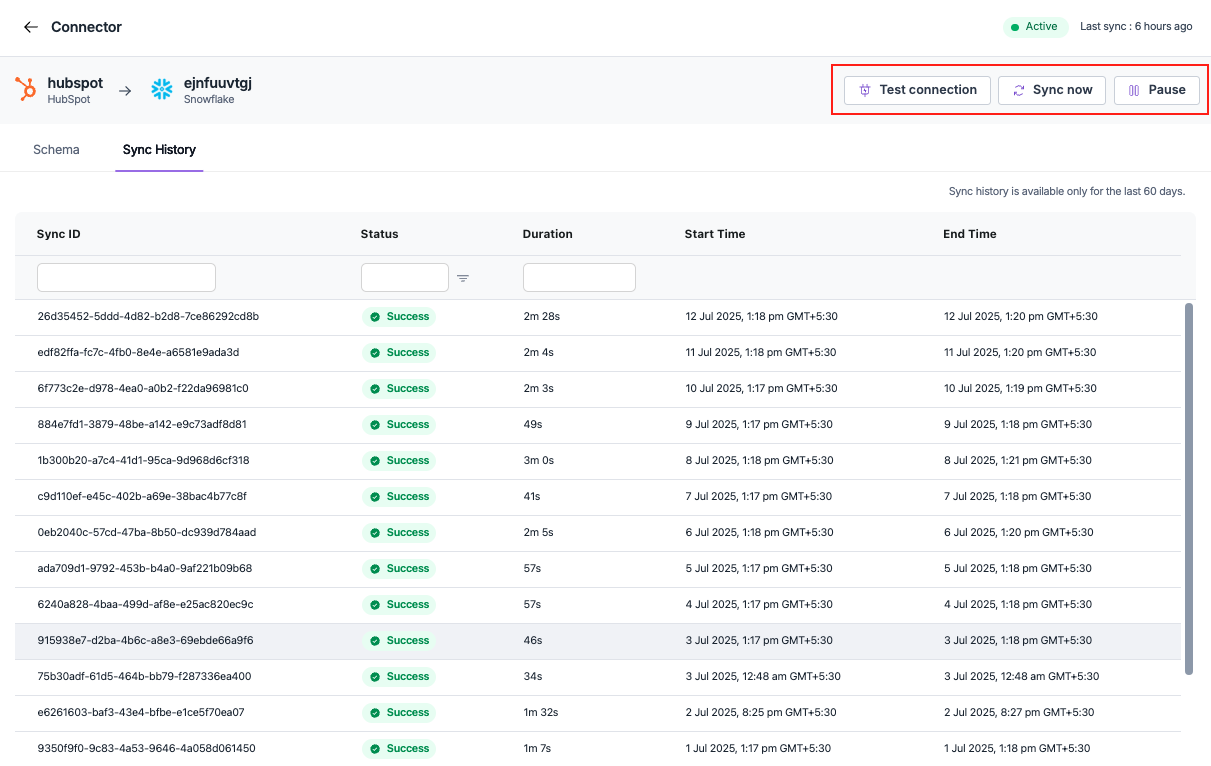 The connector detail page shows:
* **Source and destination** - Visual representation of data flow
* **Status and last sync** - Current operational state
* **Quick actions** - Test connection, Sync now, Pause
* **Navigation tabs** - Schema and Sync History
### Test connection
Use the **Test connection** button to verify connectivity and diagnose issues:
Click **Test connection** to start verification
System verifies credentials and permissions
Tests network connectivity to source system
Displays success or detailed error information
The connector detail page shows:
* **Source and destination** - Visual representation of data flow
* **Status and last sync** - Current operational state
* **Quick actions** - Test connection, Sync now, Pause
* **Navigation tabs** - Schema and Sync History
### Test connection
Use the **Test connection** button to verify connectivity and diagnose issues:
Click **Test connection** to start verification
System verifies credentials and permissions
Tests network connectivity to source system
Displays success or detailed error information
 **Common test results:**
* **Success** - Connection is working properly
* **Authentication failed** - Credentials need updating
* **Connection timeout** - Network or firewall issues
* **Permission denied** - Insufficient access rights
## Sync history
### Monitoring sync performance
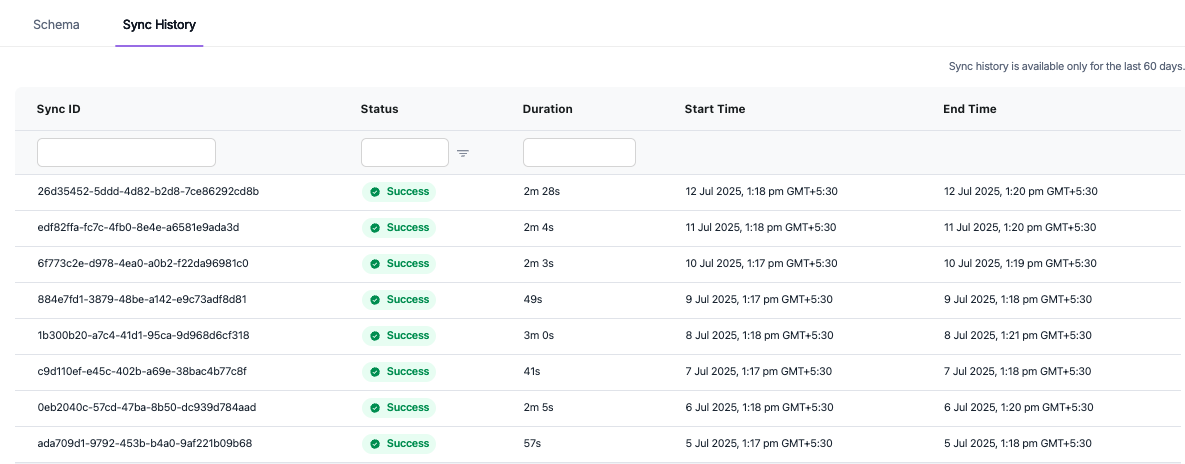
The Sync History tab provides detailed information about all sync runs:
**Common test results:**
* **Success** - Connection is working properly
* **Authentication failed** - Credentials need updating
* **Connection timeout** - Network or firewall issues
* **Permission denied** - Insufficient access rights
## Sync history
### Monitoring sync performance
The Sync History tab provides detailed information about all sync runs:
 ### History details
Each sync run displays:
**Sync ID** - Unique identifier for the specific sync run
**Status** - Success, Failed, or In Progress
* **Success** - Sync completed without errors
* **Failed** - Sync encountered errors and stopped
* **In Progress** - Sync is currently running
**Duration** - Total time taken for the sync (2m 28s, 41s, etc.)
**Start Time** - When the sync began execution
**End Time** - When the sync completed
### Performance insights
Use sync history to:
* **Identify trends** - Monitor sync duration over time
* **Spot issues** - Find patterns in failed syncs
* **Optimize timing** - Adjust frequency based on performance
* **Troubleshoot** - Investigate specific sync failures
Sync history is available for the last 60 days, helping you track long-term performance trends and identify optimization opportunities.
## Troubleshooting
### Common issues and solutions
**Symptoms:** Test connection fails, sync status shows "Broken"
**Common causes:**
* Expired or changed authentication credentials
* Network connectivity issues
* Source system maintenance or downtime
* Firewall or security policy changes
**Solutions:**
1. Use **Test connection** to diagnose the specific issue
2. Update credentials in **Edit setup** if authentication failed
3. Check source system status and availability
4. Contact your IT team for network/firewall issues
**Symptoms:** Increasing sync duration, frequent timeouts
**Common causes:**
* Growing data volume in source system
* Network latency or bandwidth limitations
* Source system performance degradation
* Suboptimal sync frequency settings
**Solutions:**
1. Review sync history for performance trends
2. Adjust sync frequency to reduce load
3. Consider filtering data to reduce volume
4. Contact support for optimization guidance
**Symptoms:** Status shows "Incomplete", missing expected data
**Common causes:**
* Setup process not fully completed
* Missing required configuration parameters
* Insufficient permissions on source system
* Schema changes in source system
**Solutions:**
1. Use **Edit setup** to complete configuration
2. Verify all required fields are populated
3. Check source system permissions
4. Review and approve any schema changes
## Best practices
### Sync frequency optimization
**Choose appropriate frequencies:**
* **High-frequency syncs** for operational data that changes frequently
* **Standard frequencies** for most business reporting needs
* **Low-frequency syncs** for historical or slowly changing data
**Consider system impact:**
* Avoid overwhelming source systems with too frequent syncs
* Balance data freshness needs with system performance
* Use off-peak hours for large data volumes
***
## Next steps
**Set up alerts**
Configure notifications for sync failures and performance issues.
### History details
Each sync run displays:
**Sync ID** - Unique identifier for the specific sync run
**Status** - Success, Failed, or In Progress
* **Success** - Sync completed without errors
* **Failed** - Sync encountered errors and stopped
* **In Progress** - Sync is currently running
**Duration** - Total time taken for the sync (2m 28s, 41s, etc.)
**Start Time** - When the sync began execution
**End Time** - When the sync completed
### Performance insights
Use sync history to:
* **Identify trends** - Monitor sync duration over time
* **Spot issues** - Find patterns in failed syncs
* **Optimize timing** - Adjust frequency based on performance
* **Troubleshoot** - Investigate specific sync failures
Sync history is available for the last 60 days, helping you track long-term performance trends and identify optimization opportunities.
## Troubleshooting
### Common issues and solutions
**Symptoms:** Test connection fails, sync status shows "Broken"
**Common causes:**
* Expired or changed authentication credentials
* Network connectivity issues
* Source system maintenance or downtime
* Firewall or security policy changes
**Solutions:**
1. Use **Test connection** to diagnose the specific issue
2. Update credentials in **Edit setup** if authentication failed
3. Check source system status and availability
4. Contact your IT team for network/firewall issues
**Symptoms:** Increasing sync duration, frequent timeouts
**Common causes:**
* Growing data volume in source system
* Network latency or bandwidth limitations
* Source system performance degradation
* Suboptimal sync frequency settings
**Solutions:**
1. Review sync history for performance trends
2. Adjust sync frequency to reduce load
3. Consider filtering data to reduce volume
4. Contact support for optimization guidance
**Symptoms:** Status shows "Incomplete", missing expected data
**Common causes:**
* Setup process not fully completed
* Missing required configuration parameters
* Insufficient permissions on source system
* Schema changes in source system
**Solutions:**
1. Use **Edit setup** to complete configuration
2. Verify all required fields are populated
3. Check source system permissions
4. Review and approve any schema changes
## Best practices
### Sync frequency optimization
**Choose appropriate frequencies:**
* **High-frequency syncs** for operational data that changes frequently
* **Standard frequencies** for most business reporting needs
* **Low-frequency syncs** for historical or slowly changing data
**Consider system impact:**
* Avoid overwhelming source systems with too frequent syncs
* Balance data freshness needs with system performance
* Use off-peak hours for large data volumes
***
## Next steps
**Set up alerts**
Configure notifications for sync failures and performance issues.