> ## Documentation Index
> Fetch the complete documentation index at: https://docs.5x.co/llms.txt
> Use this file to discover all available pages before exploring further.
# Monitoring & Alerts
> Set up proactive alerts for your data ingestion pipelines to stay informed about sync status, failures, and data usage
**Focus:** Configure alerts to get notified about sync failures, successful completions, and data usage thresholds across your ingestion connectors.
Stay on top of your data pipeline health with comprehensive alerting that notifies you through Slack channels or email when important events occur in your ingestion workflows.
## Alert setup overview
5X provides flexible alert configuration to keep you informed about your data pipeline status. You can set up alerts in two ways:
**Quick connector alerts**
Set up alerts directly from the ingestion dashboard for specific connectors
**Centralized management**
Configure and manage all alerts from a single location in Settings
## Setting up alerts
### **Method 1: From connector listing page**
The quickest way to set up alerts for a specific connector is directly from the ingestion dashboard:
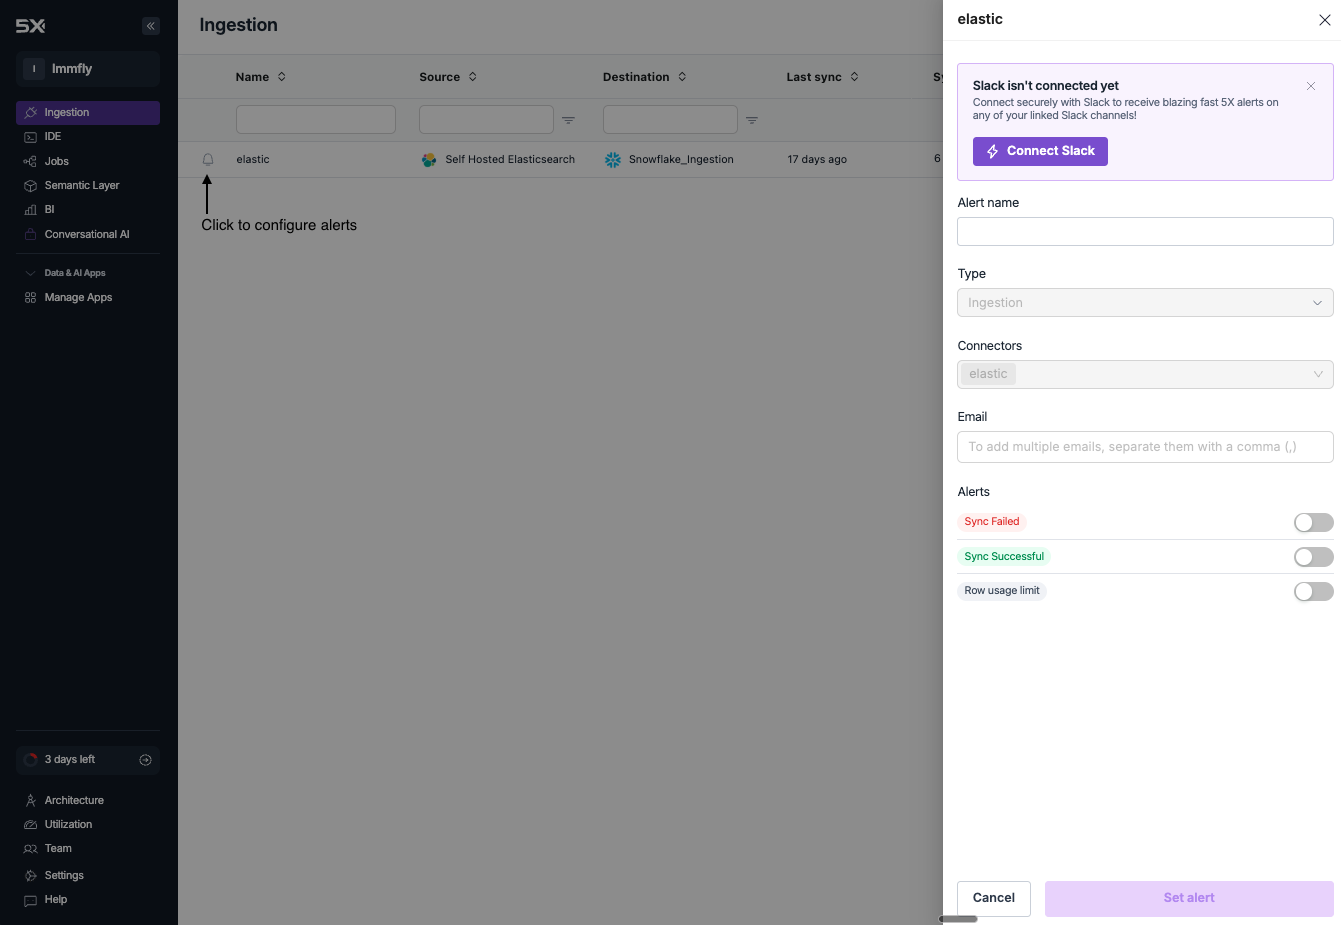 Go to **Ingestion** in the main navigation to view your connectors
Next to each connector, click the **icon** to open the alert configuration dialog
Set up your alert preferences including:
* Alert name
* Connector selection (pre-selected)
* Alert types (Sync Failed, Sync Successful, Row usage limit)
* Delivery channels (Slack and/or Email)
Click **Set alert** to activate the alert for that specific connector
### **Method 2: From settings panel**
For comprehensive alert management across all connectors:
Go to **Ingestion** in the main navigation to view your connectors
Next to each connector, click the **icon** to open the alert configuration dialog
Set up your alert preferences including:
* Alert name
* Connector selection (pre-selected)
* Alert types (Sync Failed, Sync Successful, Row usage limit)
* Delivery channels (Slack and/or Email)
Click **Set alert** to activate the alert for that specific connector
### **Method 2: From settings panel**
For comprehensive alert management across all connectors:
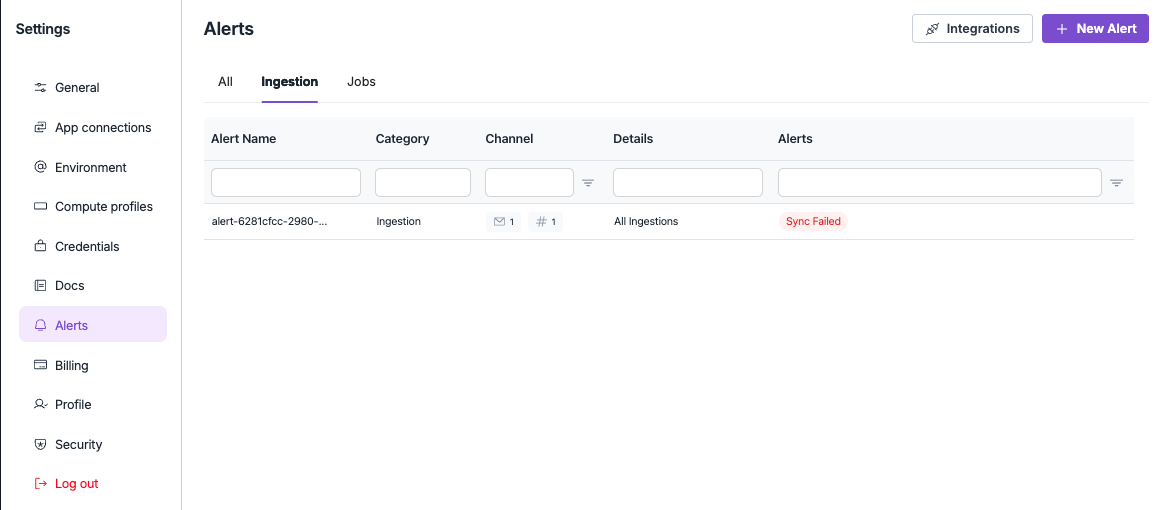 Navigate to **Settings** from the main navigation, then click **Alerts**
Click the **New Alert** button to open the alert configuration dialog
Set up your alert with the following options:
* **Alert name** - Descriptive name for your alert
* **Type** - Select "Ingestion" for data pipeline alerts
* **Connectors** - Choose which connectors to monitor
* **Channel** - Select Slack channels for notifications
* **Email** - Add email addresses for notifications
* **Alert types** - Choose specific alert conditions
Click **Set alert** to create and activate your new alert
### **Editing existing alerts**
To modify an existing alert from the Settings panel:
In **Settings → Alerts**, locate the alert you want to modify
Click on the alert name or row to open the edit dialog
Modify any alert settings including connectors, channels, or alert types
Click **Update alert** to save your changes
## Alert types
Configure different alert types based on your monitoring needs:
**Get notified when syncs fail**
Receive immediate notifications when data synchronization fails for your connectors.
**When this alert triggers:**
* Sync encounters an error and cannot complete
* Connection to data source fails
* Authentication or permission issues occur
* Data transformation errors during processing
**Best practices:**
* Set up for all critical connectors
* Route to appropriate team channels
* Include escalation for repeated failures
**Confirmation of successful syncs**
Stay informed when data synchronization completes successfully.
**When this alert triggers:**
* Sync completes without errors
* All data successfully loaded to warehouse
* Schema changes detected and handled
* Scheduled sync runs on time
**Best practices:**
* Use for critical business data
* Consider digest format for frequent syncs
* Useful for compliance and audit trails
* Monitor sync completion times
**Monitor data volume thresholds**
Get alerts when data processing approaches or exceeds usage limits.
**When this alert triggers:**
* Combined row count across connectors exceeds threshold
* Individual connector processes excessive data
* Unexpected data volume spikes detected
* Approaching monthly or daily limits
**Configuration options:**
* Set threshold in millions of rows (e.g., 20 million)
* Daily reset monitoring
* Percentage-based warnings (e.g., 80% of limit)
* Connector-specific limits
**Best practices:**
* Set threshold below actual limits
* Monitor for data anomalies
* Plan for business growth
* Review limits regularly
## Alert configuration best practices
### **Alert organization**
Structure your alerts for maximum effectiveness:
**Focused monitoring**
Set up dedicated alerts for critical connectors with specific requirements
**Proper escalation**
Route alerts to appropriate teams based on connector ownership
**Prioritization**
Use different channels for different alert severities
**Alert fatigue**
Avoid overwhelming teams with too many notifications
### **Alert naming conventions**
Use consistent naming for better organization:
**Naming structure:**
* **Environment prefix** - `[PROD]`, `[STAGING]`, `[DEV]`
* **Connector name** - Clear identifier for the data source
* **Alert type** - `Sync Failed`, `Usage Limit`, etc.
* **Team identifier** - Responsible team or department
**Examples:**
* `[PROD] Salesforce - Sync Failed - Sales Team`
* `[PROD] PostgreSQL - Usage Limit - Data Engineering`
* `[STAGING] BigQuery - Sync Successful - QA Team`
***
Navigate to **Settings** from the main navigation, then click **Alerts**
Click the **New Alert** button to open the alert configuration dialog
Set up your alert with the following options:
* **Alert name** - Descriptive name for your alert
* **Type** - Select "Ingestion" for data pipeline alerts
* **Connectors** - Choose which connectors to monitor
* **Channel** - Select Slack channels for notifications
* **Email** - Add email addresses for notifications
* **Alert types** - Choose specific alert conditions
Click **Set alert** to create and activate your new alert
### **Editing existing alerts**
To modify an existing alert from the Settings panel:
In **Settings → Alerts**, locate the alert you want to modify
Click on the alert name or row to open the edit dialog
Modify any alert settings including connectors, channels, or alert types
Click **Update alert** to save your changes
## Alert types
Configure different alert types based on your monitoring needs:
**Get notified when syncs fail**
Receive immediate notifications when data synchronization fails for your connectors.
**When this alert triggers:**
* Sync encounters an error and cannot complete
* Connection to data source fails
* Authentication or permission issues occur
* Data transformation errors during processing
**Best practices:**
* Set up for all critical connectors
* Route to appropriate team channels
* Include escalation for repeated failures
**Confirmation of successful syncs**
Stay informed when data synchronization completes successfully.
**When this alert triggers:**
* Sync completes without errors
* All data successfully loaded to warehouse
* Schema changes detected and handled
* Scheduled sync runs on time
**Best practices:**
* Use for critical business data
* Consider digest format for frequent syncs
* Useful for compliance and audit trails
* Monitor sync completion times
**Monitor data volume thresholds**
Get alerts when data processing approaches or exceeds usage limits.
**When this alert triggers:**
* Combined row count across connectors exceeds threshold
* Individual connector processes excessive data
* Unexpected data volume spikes detected
* Approaching monthly or daily limits
**Configuration options:**
* Set threshold in millions of rows (e.g., 20 million)
* Daily reset monitoring
* Percentage-based warnings (e.g., 80% of limit)
* Connector-specific limits
**Best practices:**
* Set threshold below actual limits
* Monitor for data anomalies
* Plan for business growth
* Review limits regularly
## Alert configuration best practices
### **Alert organization**
Structure your alerts for maximum effectiveness:
**Focused monitoring**
Set up dedicated alerts for critical connectors with specific requirements
**Proper escalation**
Route alerts to appropriate teams based on connector ownership
**Prioritization**
Use different channels for different alert severities
**Alert fatigue**
Avoid overwhelming teams with too many notifications
### **Alert naming conventions**
Use consistent naming for better organization:
**Naming structure:**
* **Environment prefix** - `[PROD]`, `[STAGING]`, `[DEV]`
* **Connector name** - Clear identifier for the data source
* **Alert type** - `Sync Failed`, `Usage Limit`, etc.
* **Team identifier** - Responsible team or department
**Examples:**
* `[PROD] Salesforce - Sync Failed - Sales Team`
* `[PROD] PostgreSQL - Usage Limit - Data Engineering`
* `[STAGING] BigQuery - Sync Successful - QA Team`
***