> ## Documentation Index
> Fetch the complete documentation index at: https://docs.5x.co/llms.txt
> Use this file to discover all available pages before exploring further.
# Datasets & SQL Lab
> Explore datasets, write custom SQL queries, and manage data sources for powerful analytics
**Focus:** Learn how to explore datasets, write custom SQL queries, and leverage SQL Lab for advanced data analysis and visualization.
5X Business Intelligence provides powerful dataset management and SQL Lab capabilities that enable you to explore your data, write custom queries, and create sophisticated analytics. Whether you're a business analyst or data engineer, these tools give you the flexibility to work with data exactly how you need it.
## Dataset management
### **Understanding datasets**
Datasets are the foundation of your analytics in 5X Business Intelligence. They represent your data sources and provide the raw material for creating charts, dashboards, and reports.
**What datasets provide:**
* **Data access** - Direct connection to your warehouse tables and views
* **Schema information** - Column types, relationships, and metadata
* **Data preview** - Sample data to understand content and structure
* **Usage tracking** - Monitor which datasets are used in visualizations
* **Security controls** - Row-level security and access permissions
### **Dataset exploration**
**Browse available datasets:**
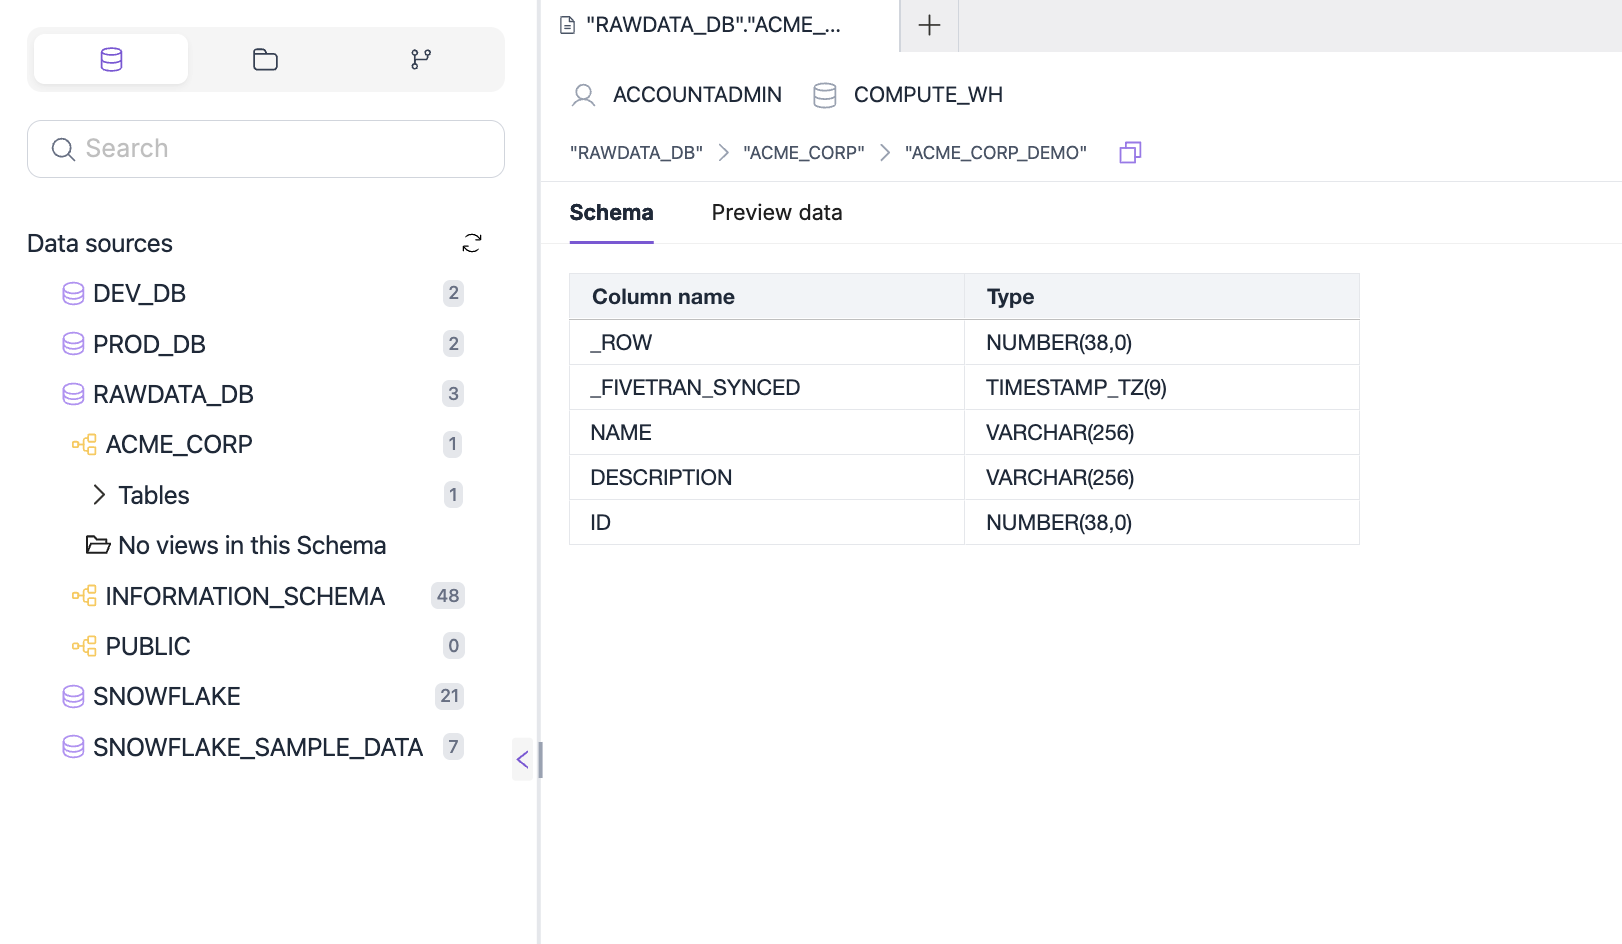 **Key exploration features:**
* **Dataset catalog** - Browse all available data sources
* **Schema viewer** - Examine table structures and column details
* **Data sampling** - Preview actual data to understand content
* **Relationship mapping** - See how datasets connect to each other
* **Usage analytics** - Track which datasets are most popular
### **Dataset configuration**
**Basic dataset settings:**
* **Name and description** - Clear identification and business context
* **Tags and categories** - Organization for easy discovery
* **Ownership** - Assign responsibility for dataset management
* **Refresh schedules** - Automatic data updates for real-time insights
**Advanced configuration:**
* **Custom SQL** - Define calculated fields and transformations
* **Caching settings** - Optimize performance with appropriate caching
* **Security policies** - Row-level security and access controls
* **Data quality rules** - Validation and monitoring settings
### **Dataset importance**
**Why datasets matter:**
* **Single source of truth** - Centralized access to business data
* **Consistency** - Standardized data definitions across the organization
* **Efficiency** - Reusable data sources for multiple analyses
* **Governance** - Controlled access and usage tracking
* **Performance** - Optimized queries and caching strategies
## SQL Lab
### **Introduction to SQL Lab**
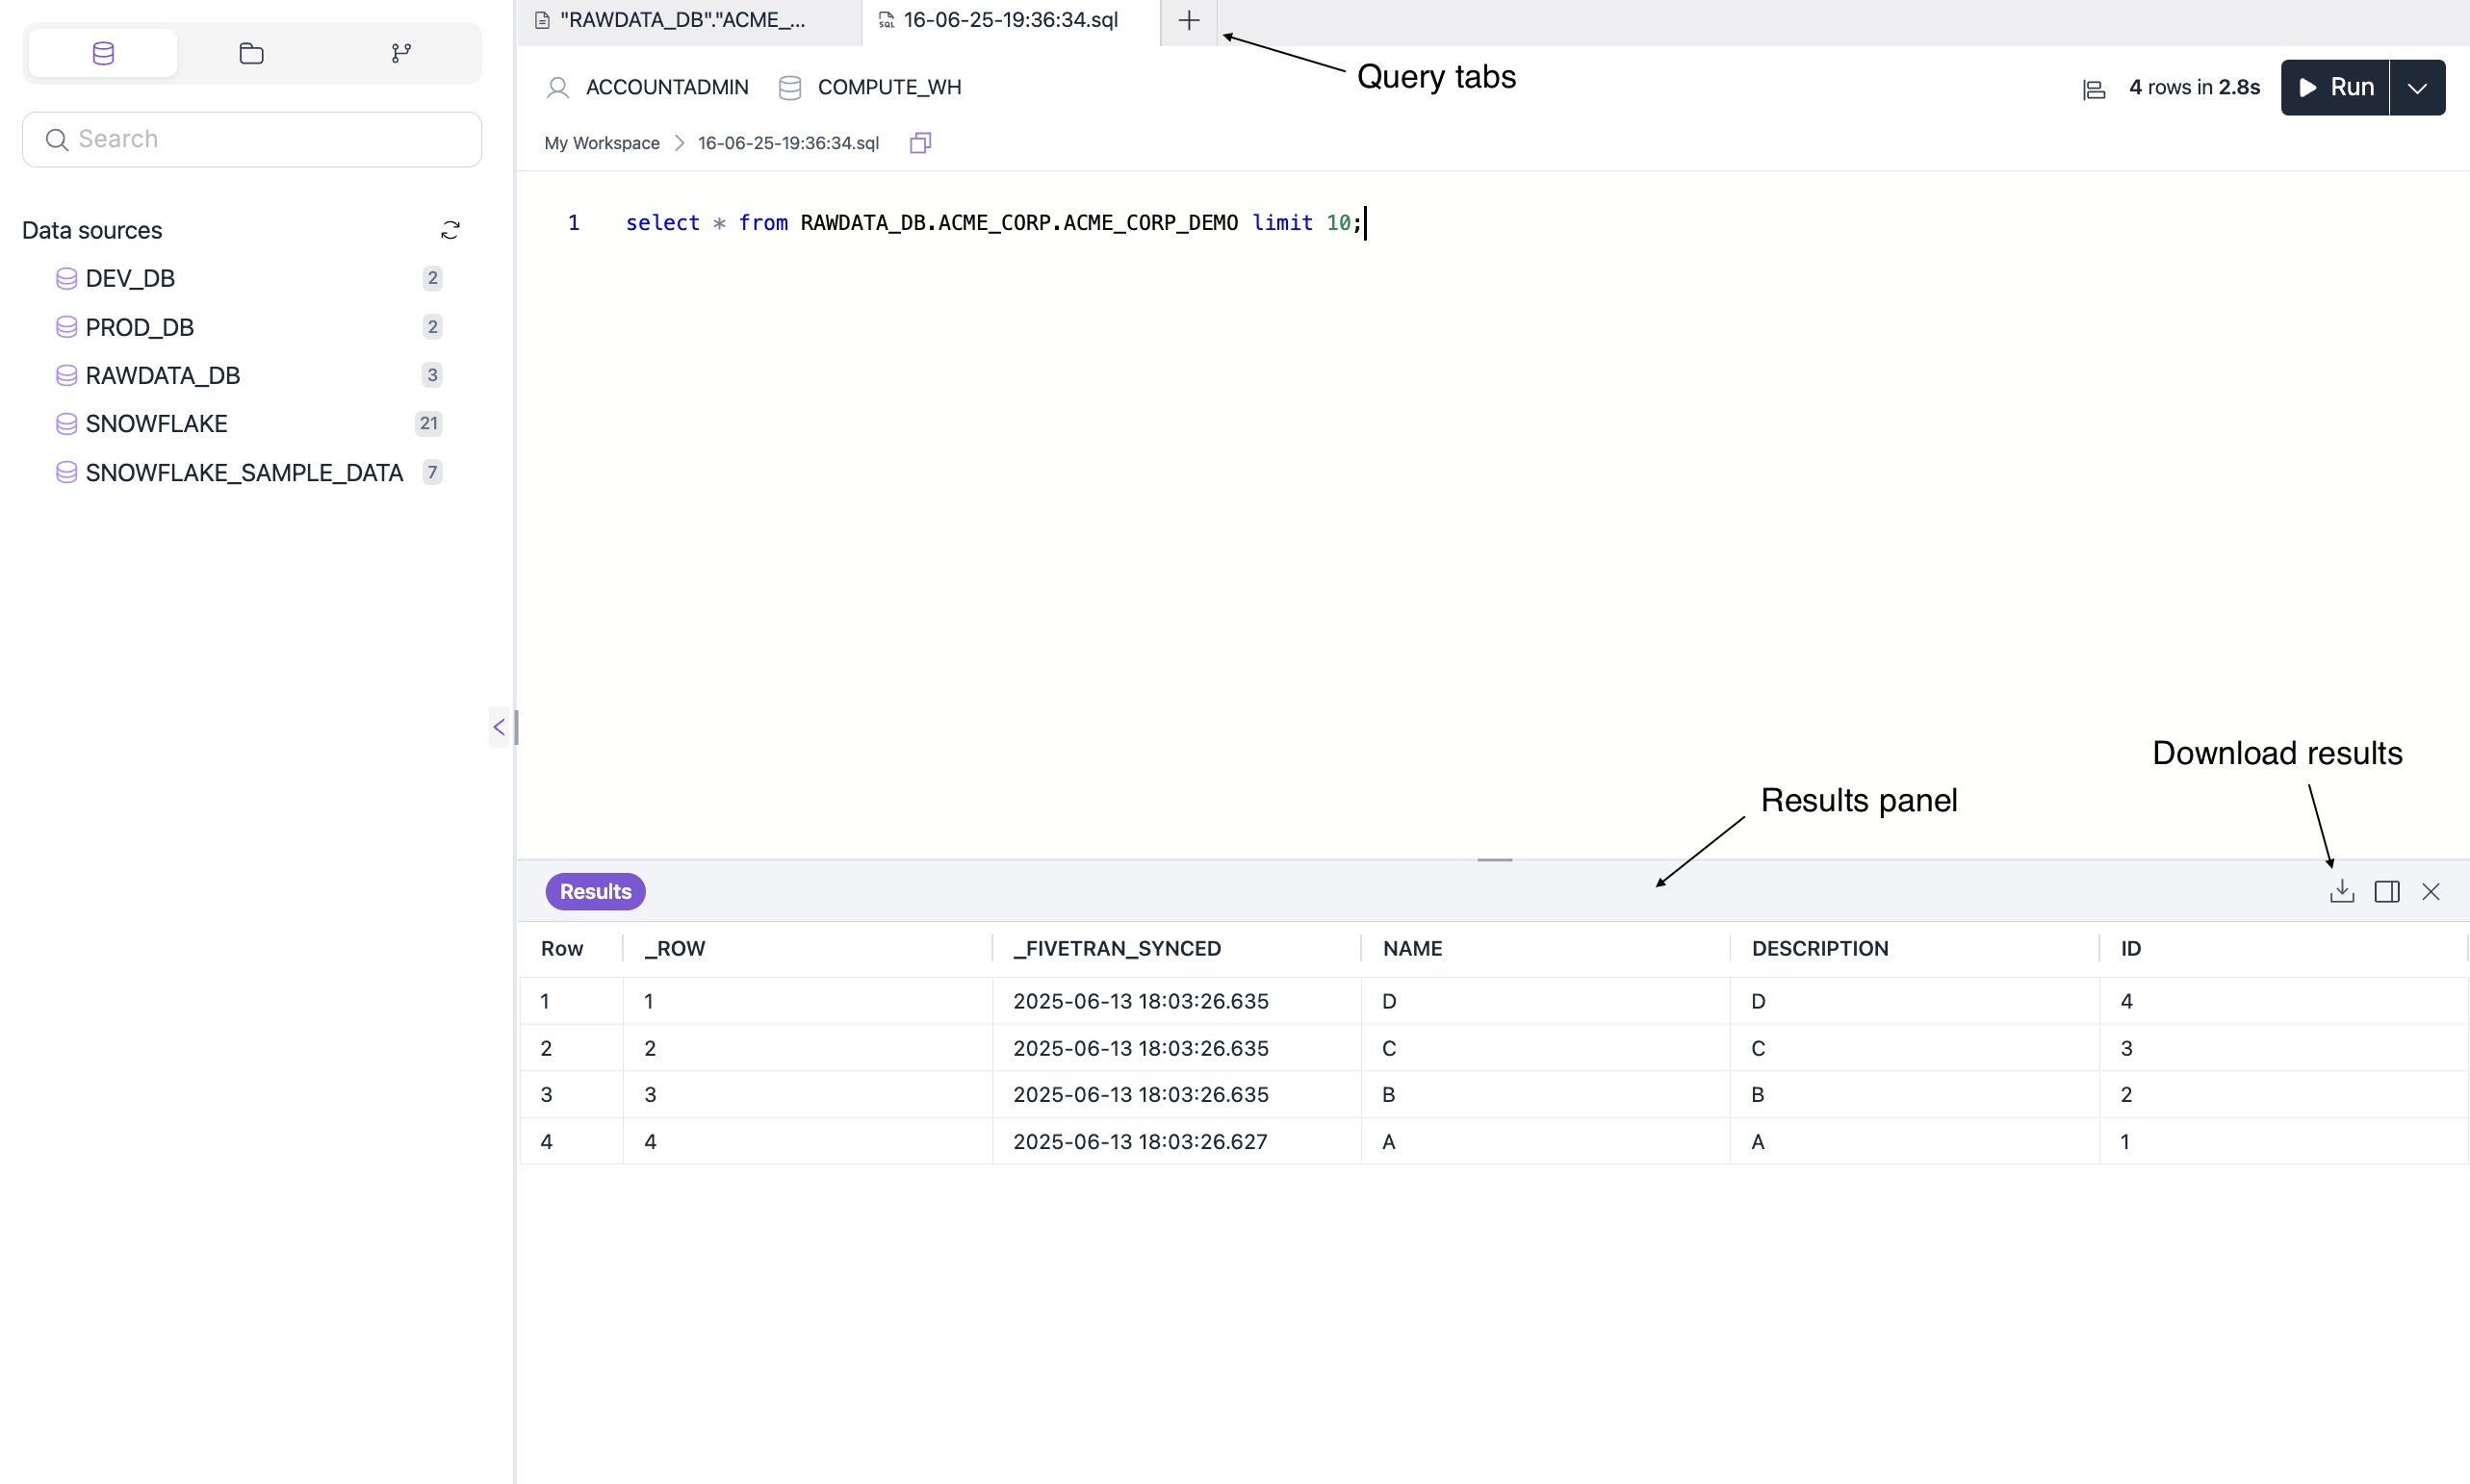
SQL Lab is 5X Business Intelligence's powerful query interface that allows you to write and execute custom SQL queries directly against your data warehouse.
**Key capabilities:**
* **Full SQL support** - Complex queries with joins, subqueries, and advanced functions
* **Query history** - Track and reuse previous queries
* **Query sharing** - Collaborate with team members
* **Result export** - Export query results in various formats
* **Query optimization** - Built-in performance suggestions
**Key exploration features:**
* **Dataset catalog** - Browse all available data sources
* **Schema viewer** - Examine table structures and column details
* **Data sampling** - Preview actual data to understand content
* **Relationship mapping** - See how datasets connect to each other
* **Usage analytics** - Track which datasets are most popular
### **Dataset configuration**
**Basic dataset settings:**
* **Name and description** - Clear identification and business context
* **Tags and categories** - Organization for easy discovery
* **Ownership** - Assign responsibility for dataset management
* **Refresh schedules** - Automatic data updates for real-time insights
**Advanced configuration:**
* **Custom SQL** - Define calculated fields and transformations
* **Caching settings** - Optimize performance with appropriate caching
* **Security policies** - Row-level security and access controls
* **Data quality rules** - Validation and monitoring settings
### **Dataset importance**
**Why datasets matter:**
* **Single source of truth** - Centralized access to business data
* **Consistency** - Standardized data definitions across the organization
* **Efficiency** - Reusable data sources for multiple analyses
* **Governance** - Controlled access and usage tracking
* **Performance** - Optimized queries and caching strategies
## SQL Lab
### **Introduction to SQL Lab**
SQL Lab is 5X Business Intelligence's powerful query interface that allows you to write and execute custom SQL queries directly against your data warehouse.
**Key capabilities:**
* **Full SQL support** - Complex queries with joins, subqueries, and advanced functions
* **Query history** - Track and reuse previous queries
* **Query sharing** - Collaborate with team members
* **Result export** - Export query results in various formats
* **Query optimization** - Built-in performance suggestions
 ### **Writing effective SQL queries**
**Query structure best practices:**
```sql theme={null}
-- Example: Well-structured query with clear formatting
SELECT
DATE_TRUNC('month', order_date) AS month,
region,
COUNT(*) AS order_count,
SUM(order_amount) AS total_revenue,
AVG(order_amount) AS avg_order_value
FROM orders
WHERE order_date >= '2024-01-01'
AND order_status = 'completed'
GROUP BY 1, 2
ORDER BY month DESC, total_revenue DESC
LIMIT 100;
```
**Query optimization techniques:**
* **Use appropriate filters** - Limit data with WHERE clauses
* **Select only needed columns** - Avoid SELECT \* for better performance
* **Leverage indexes** - Structure queries to use database indexes
* **Limit result sets** - Use LIMIT to control output size
* **Use aggregations** - Pre-aggregate data when possible
### **Advanced SQL features**
**Window functions for analytics:**
```sql theme={null}
-- Example: Using window functions for advanced analytics
SELECT
customer_id,
order_date,
order_amount,
SUM(order_amount) OVER (
PARTITION BY customer_id
ORDER BY order_date
ROWS BETWEEN UNBOUNDED PRECEDING AND CURRENT ROW
) AS running_total,
ROW_NUMBER() OVER (
PARTITION BY customer_id
ORDER BY order_date DESC
) AS order_rank
FROM orders;
```
**Common table expressions (CTEs):**
```sql theme={null}
-- Example: Using CTEs for complex analysis
WITH monthly_sales AS (
SELECT
DATE_TRUNC('month', order_date) AS month,
SUM(order_amount) AS total_sales
FROM orders
GROUP BY 1
),
sales_growth AS (
SELECT
month,
total_sales,
LAG(total_sales) OVER (ORDER BY month) AS prev_month_sales,
(total_sales - LAG(total_sales) OVER (ORDER BY month)) /
LAG(total_sales) OVER (ORDER BY month) * 100 AS growth_rate
FROM monthly_sales
)
SELECT * FROM sales_growth;
```
### **SQL Lab features**
**Query management:**
* **Save queries** - Store frequently used queries for reuse
* **Query templates** - Create reusable query patterns
* **Version control** - Track changes to saved queries
* **Collaboration** - Share queries with team members
**Result handling:**
* **Export options** - CSV, Excel, JSON formats
* **Result caching** - Store query results for faster access
* **Large result sets** - Handle big data efficiently
* **Visualization** - Quick chart creation from query results
## Creating charts from SQL
### **SQL as data source**
You can use custom SQL queries as the data source for charts, providing unlimited flexibility:
**When to use SQL for charts:**
* **Complex calculations** - Multi-step data transformations
* **Advanced filtering** - Sophisticated WHERE clauses
* **Data joins** - Combining multiple data sources
* **Performance optimization** - Optimized queries for specific use cases
**SQL chart workflow:**
1. **Write your query** - Use SQL Lab to create the query
2. **Test and validate** - Execute and verify results
3. **Create chart** - Use query results as data source
4. **Configure visualization** - Choose appropriate chart type
5. **Add to dashboard** - Include in your dashboard layout
### **Parameterized queries**
Use dashboard filters to make your SQL queries dynamic:
```sql theme={null}
-- Example: Parameterized query using dashboard filters
SELECT
DATE_TRUNC('{{ granularity }}', order_date) AS time_period,
region,
SUM(order_amount) AS total_revenue
FROM orders
WHERE order_date >= '{{ start_date }}'
AND order_date <= '{{ end_date }}'
{% if region %}
AND region = '{{ region }}'
{% endif %}
GROUP BY 1, 2
ORDER BY time_period DESC;
```
**Parameter types:**
* **Date parameters** - Dynamic date ranges
* **Text parameters** - Categorical filters
* **Numeric parameters** - Value range filters
* **Boolean parameters** - True/false conditions
## Data quality and validation
### **Data profiling**
**Understanding your data:**
* **Completeness** - Percentage of non-null values
* **Uniqueness** - Duplicate record identification
* **Consistency** - Data format and value consistency
* **Accuracy** - Data correctness and validity
* **Timeliness** - Data freshness and update frequency
**Profiling techniques:**
* **Column analysis** - Data types, ranges, and distributions
* **Pattern recognition** - Identify common data patterns
* **Outlier detection** - Find unusual or suspicious values
* **Relationship analysis** - Understand data dependencies
### **Data validation queries**
```sql theme={null}
-- Example: Data quality validation queries
-- Check for missing values
SELECT
COUNT(*) AS total_records,
COUNT(customer_id) AS non_null_customer_ids,
COUNT(*) - COUNT(customer_id) AS missing_customer_ids
FROM orders;
-- Check for duplicate records
SELECT
customer_id,
order_date,
COUNT(*) AS duplicate_count
FROM orders
GROUP BY 1, 2
HAVING COUNT(*) > 1;
-- Check for outliers
SELECT
customer_id,
order_amount
FROM orders
WHERE order_amount > (
SELECT AVG(order_amount) + 3 * STDDEV(order_amount)
FROM orders
);
```
## Best practices
### **Dataset management**
**Clear structure**
Use consistent naming conventions, tags, and categories to organize your datasets effectively.
**Add context**
Include descriptions, business context, and usage notes for each dataset.
**Track performance**
Monitor dataset usage patterns and optimize frequently accessed datasets.
**Control access**
Implement appropriate security policies and row-level security where needed.
### **SQL development**
**Build incrementally**
Start with simple queries and gradually add complexity as you understand the data better.
**Add comments**
Include comments in your SQL queries to explain complex logic and business rules.
**Validate results**
Always test queries with small datasets before running on large data volumes.
**Efficient queries**
Write efficient queries that perform well and don't impact system performance.
## Troubleshooting
### **Common issues**
**Possible causes:**
* Insufficient permissions for dataset access
* App connection configuration problems
* Data source connectivity issues
* Row-level security restrictions
**Solutions:**
* Verify user permissions and roles
* Check App Connection settings
* Test data source connectivity
* Review security policies
**Possible causes:**
* Inefficient query structure
* Large dataset volumes
* Missing database indexes
* Complex calculations or joins
**Solutions:**
* Optimize query structure and logic
* Use appropriate filters and limits
* Check database indexing strategy
* Consider data aggregation approaches
**Possible causes:**
* Missing or null values
* Data format inconsistencies
* Outdated or stale data
* Data integration problems
**Solutions:**
* Implement data validation checks
* Standardize data formats
* Update data refresh schedules
* Review data integration processes
***
**Create visualizations**
Use your datasets and SQL queries to build compelling charts and dashboards.
**Build dashboards**
Combine your datasets and SQL insights into interactive dashboards.
**Connect data sources**
Learn how to set up App Connections to access your data warehouse.
**Explore your data**
Dive deeper into data exploration techniques and advanced analytics.
***
### **Writing effective SQL queries**
**Query structure best practices:**
```sql theme={null}
-- Example: Well-structured query with clear formatting
SELECT
DATE_TRUNC('month', order_date) AS month,
region,
COUNT(*) AS order_count,
SUM(order_amount) AS total_revenue,
AVG(order_amount) AS avg_order_value
FROM orders
WHERE order_date >= '2024-01-01'
AND order_status = 'completed'
GROUP BY 1, 2
ORDER BY month DESC, total_revenue DESC
LIMIT 100;
```
**Query optimization techniques:**
* **Use appropriate filters** - Limit data with WHERE clauses
* **Select only needed columns** - Avoid SELECT \* for better performance
* **Leverage indexes** - Structure queries to use database indexes
* **Limit result sets** - Use LIMIT to control output size
* **Use aggregations** - Pre-aggregate data when possible
### **Advanced SQL features**
**Window functions for analytics:**
```sql theme={null}
-- Example: Using window functions for advanced analytics
SELECT
customer_id,
order_date,
order_amount,
SUM(order_amount) OVER (
PARTITION BY customer_id
ORDER BY order_date
ROWS BETWEEN UNBOUNDED PRECEDING AND CURRENT ROW
) AS running_total,
ROW_NUMBER() OVER (
PARTITION BY customer_id
ORDER BY order_date DESC
) AS order_rank
FROM orders;
```
**Common table expressions (CTEs):**
```sql theme={null}
-- Example: Using CTEs for complex analysis
WITH monthly_sales AS (
SELECT
DATE_TRUNC('month', order_date) AS month,
SUM(order_amount) AS total_sales
FROM orders
GROUP BY 1
),
sales_growth AS (
SELECT
month,
total_sales,
LAG(total_sales) OVER (ORDER BY month) AS prev_month_sales,
(total_sales - LAG(total_sales) OVER (ORDER BY month)) /
LAG(total_sales) OVER (ORDER BY month) * 100 AS growth_rate
FROM monthly_sales
)
SELECT * FROM sales_growth;
```
### **SQL Lab features**
**Query management:**
* **Save queries** - Store frequently used queries for reuse
* **Query templates** - Create reusable query patterns
* **Version control** - Track changes to saved queries
* **Collaboration** - Share queries with team members
**Result handling:**
* **Export options** - CSV, Excel, JSON formats
* **Result caching** - Store query results for faster access
* **Large result sets** - Handle big data efficiently
* **Visualization** - Quick chart creation from query results
## Creating charts from SQL
### **SQL as data source**
You can use custom SQL queries as the data source for charts, providing unlimited flexibility:
**When to use SQL for charts:**
* **Complex calculations** - Multi-step data transformations
* **Advanced filtering** - Sophisticated WHERE clauses
* **Data joins** - Combining multiple data sources
* **Performance optimization** - Optimized queries for specific use cases
**SQL chart workflow:**
1. **Write your query** - Use SQL Lab to create the query
2. **Test and validate** - Execute and verify results
3. **Create chart** - Use query results as data source
4. **Configure visualization** - Choose appropriate chart type
5. **Add to dashboard** - Include in your dashboard layout
### **Parameterized queries**
Use dashboard filters to make your SQL queries dynamic:
```sql theme={null}
-- Example: Parameterized query using dashboard filters
SELECT
DATE_TRUNC('{{ granularity }}', order_date) AS time_period,
region,
SUM(order_amount) AS total_revenue
FROM orders
WHERE order_date >= '{{ start_date }}'
AND order_date <= '{{ end_date }}'
{% if region %}
AND region = '{{ region }}'
{% endif %}
GROUP BY 1, 2
ORDER BY time_period DESC;
```
**Parameter types:**
* **Date parameters** - Dynamic date ranges
* **Text parameters** - Categorical filters
* **Numeric parameters** - Value range filters
* **Boolean parameters** - True/false conditions
## Data quality and validation
### **Data profiling**
**Understanding your data:**
* **Completeness** - Percentage of non-null values
* **Uniqueness** - Duplicate record identification
* **Consistency** - Data format and value consistency
* **Accuracy** - Data correctness and validity
* **Timeliness** - Data freshness and update frequency
**Profiling techniques:**
* **Column analysis** - Data types, ranges, and distributions
* **Pattern recognition** - Identify common data patterns
* **Outlier detection** - Find unusual or suspicious values
* **Relationship analysis** - Understand data dependencies
### **Data validation queries**
```sql theme={null}
-- Example: Data quality validation queries
-- Check for missing values
SELECT
COUNT(*) AS total_records,
COUNT(customer_id) AS non_null_customer_ids,
COUNT(*) - COUNT(customer_id) AS missing_customer_ids
FROM orders;
-- Check for duplicate records
SELECT
customer_id,
order_date,
COUNT(*) AS duplicate_count
FROM orders
GROUP BY 1, 2
HAVING COUNT(*) > 1;
-- Check for outliers
SELECT
customer_id,
order_amount
FROM orders
WHERE order_amount > (
SELECT AVG(order_amount) + 3 * STDDEV(order_amount)
FROM orders
);
```
## Best practices
### **Dataset management**
**Clear structure**
Use consistent naming conventions, tags, and categories to organize your datasets effectively.
**Add context**
Include descriptions, business context, and usage notes for each dataset.
**Track performance**
Monitor dataset usage patterns and optimize frequently accessed datasets.
**Control access**
Implement appropriate security policies and row-level security where needed.
### **SQL development**
**Build incrementally**
Start with simple queries and gradually add complexity as you understand the data better.
**Add comments**
Include comments in your SQL queries to explain complex logic and business rules.
**Validate results**
Always test queries with small datasets before running on large data volumes.
**Efficient queries**
Write efficient queries that perform well and don't impact system performance.
## Troubleshooting
### **Common issues**
**Possible causes:**
* Insufficient permissions for dataset access
* App connection configuration problems
* Data source connectivity issues
* Row-level security restrictions
**Solutions:**
* Verify user permissions and roles
* Check App Connection settings
* Test data source connectivity
* Review security policies
**Possible causes:**
* Inefficient query structure
* Large dataset volumes
* Missing database indexes
* Complex calculations or joins
**Solutions:**
* Optimize query structure and logic
* Use appropriate filters and limits
* Check database indexing strategy
* Consider data aggregation approaches
**Possible causes:**
* Missing or null values
* Data format inconsistencies
* Outdated or stale data
* Data integration problems
**Solutions:**
* Implement data validation checks
* Standardize data formats
* Update data refresh schedules
* Review data integration processes
***
**Create visualizations**
Use your datasets and SQL queries to build compelling charts and dashboards.
**Build dashboards**
Combine your datasets and SQL insights into interactive dashboards.
**Connect data sources**
Learn how to set up App Connections to access your data warehouse.
**Explore your data**
Dive deeper into data exploration techniques and advanced analytics.
***